
By PulsHealth. Updated
Real data exampleResearch reviewed . Figures use example Apple Health data.
What does Apple Health Sleep Analysis record?
Sleep Analysis is a sequence of time intervals labeled with a sleep state. It can answer when sleep was recorded, how much elapsed time was labeled asleep, and how the estimated stages changed. It is not a single sleep-quality score or a diagnosis.
Each row has a start, an end and one category value. The number of rows describes how finely the night was segmented, not the number of nights slept. A quiet, continuous block may be one row; a night with many stage changes may contain dozens.
What do Core, Deep, REM and In Bed mean?
The categories describe different things, so they need different denominators. Apple's sleep-category documentation explicitly permits In Bed to overlap the detailed sleep stream.
| Value | State | Count toward time asleep? |
|---|---|---|
| 0 | In Bed | No; keep as a separate envelope |
| 1 | Asleep unspecified | Yes; the stage is unknown |
| 2 | Awake | No |
| 3 | Core | Yes; light or intermediate sleep |
| 4 | Deep | Yes; estimated deep sleep |
| 5 | REM | Yes; estimated REM sleep |
Core includes N2 and some N1 in Apple's definition. A stage label is a device estimate, not a direct brain-wave measurement. Avoid treating a short Deep segment or an absent REM label as proof of a disorder.
What does a real recorded night look like?
The figure below shows actual intervals from example user data, with dates and device identity removed. The horizontal axis measures elapsed hours rather than wall-clock time. Long bars are sustained recorded states; short bars are brief segments.
There were no In Bed rows in the example year-long snapshot. The empty lane makes that absence visible. It means time in bed cannot be calculated from these records; it does not mean the person never spent time in bed. Apple notes that Watch Awake samples occur between sleep samples, so their total can also omit wakefulness at the beginning and end of a session.
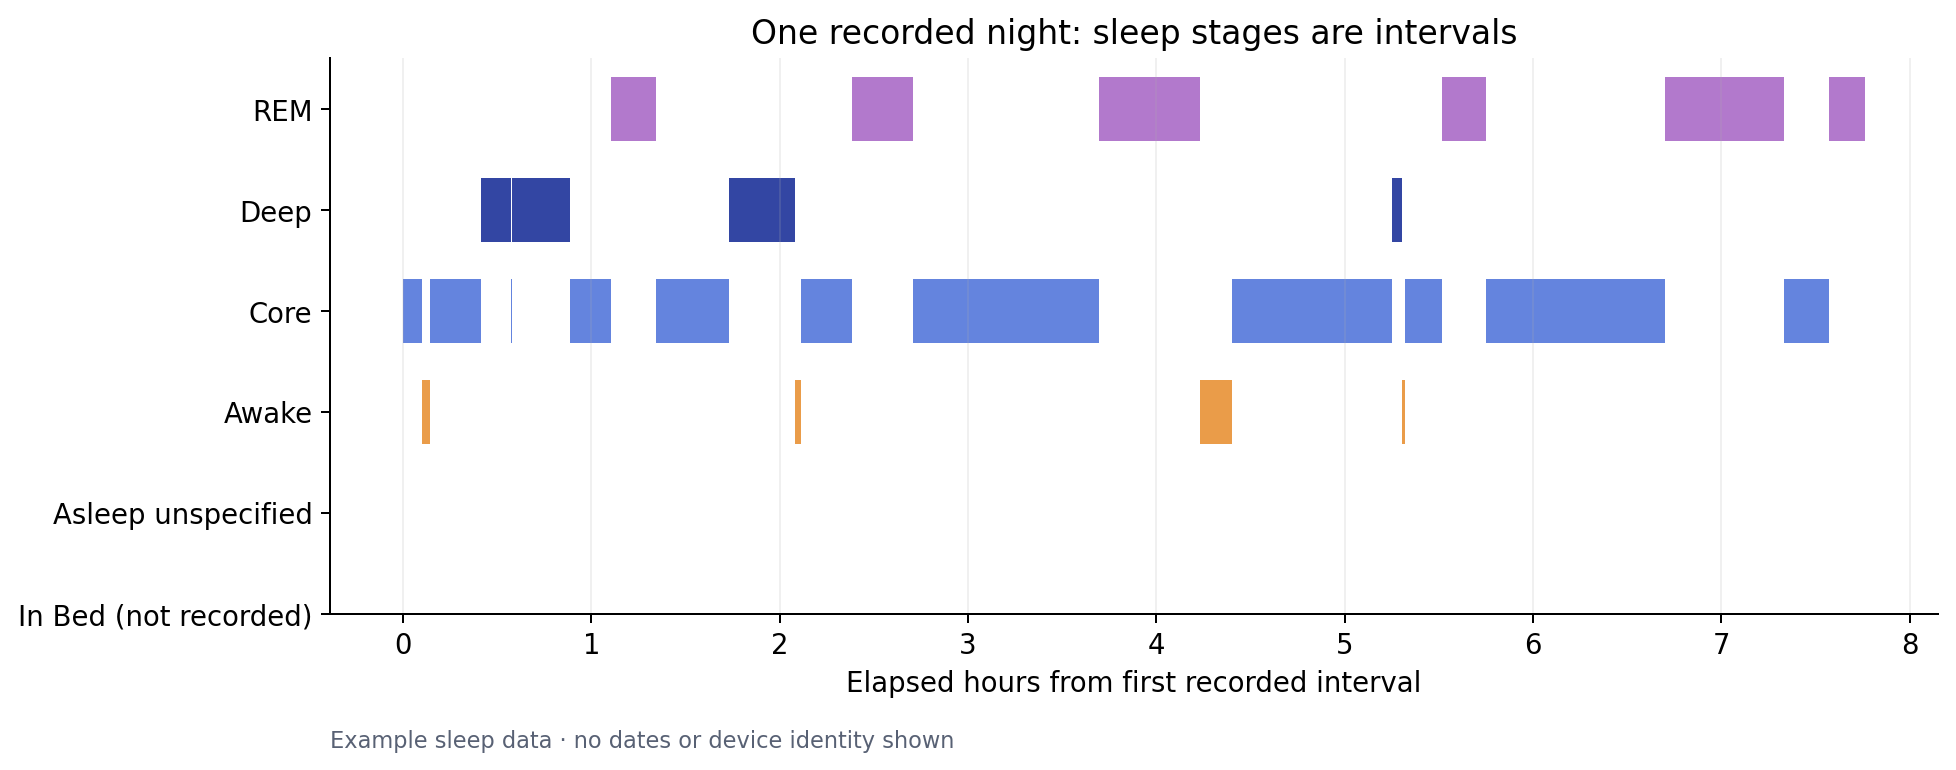
One recorded night: sleep stages are intervals
Example Apple Health records. In Bed was not recorded; stage bars show intervals rather than fixed-frequency measurements. Dates and device identity are omitted.
View full-size figureHow this figure was made
A recorded night close to the dataset median, excluding reporting boundaries and detailed-stage conflicts. Noon-to-noon bin; elapsed hours from first interval. All available categories retained; no synthetic In Bed envelope.
How often are sleep records created?
There is no fixed row cadence. Apple describes classification windows in its sleep-stage validation paper, but consecutive classifications can become a longer stored interval. A row boundary is a recorded state transition, not an independent reading every thirty seconds.
In the researched year, 10,941 intervals covered 363 of 364 eligible reporting nights after excluding truncated boundary bins. Median individual segments were about 15 minutes for Core, 8.5 minutes for Deep, 19 minutes for REM and 2 minutes for Awake. Those figures describe this dataset's segmentation, not expected stage durations per night.
Short daytime episodes need separate attention. The analysis found 18 candidate episodes lasting under three hours; none carried detailed Core, Deep or REM stages. These were identified by time and duration, so calling every one a confirmed nap would overstate the evidence. Apple's 2025 paper describes version-dependent binary sleep/wake reporting for shorter sessions. Preserve Asleep unspecified rather than dropping it because staging is missing.
How do you calculate total time asleep?
Choose your sources, retain categories 1, 3, 4 and 5, and calculate the union of their intervals. Do not add In Bed or Awake. Unioning avoids counting the same elapsed minute twice when sources or stages overlap. It does not decide which conflicting stage label is correct; conflicting detailed labels need a separate source-selection policy.
The next figure compares all-row duration totals with asleep-only totals and the asleep union. In the example records, asleep row sums and the union agreed to within tiny timestamp-boundary differences. The substantial excess came from adding Awake, not from duplicate asleep sources. Across the 92-night focus window, that mistake added a median of about 24 minutes per reporting night.
For this case, median asleep union time was about 7.6 hours in the focus window, with the middle 90% of recorded nights spanning about 5.6–8.9 hours. This is an observed example distribution, not a clinical normal range. In Bed was unavailable, so sleep efficiency and time-to-fall-asleep were not calculated.
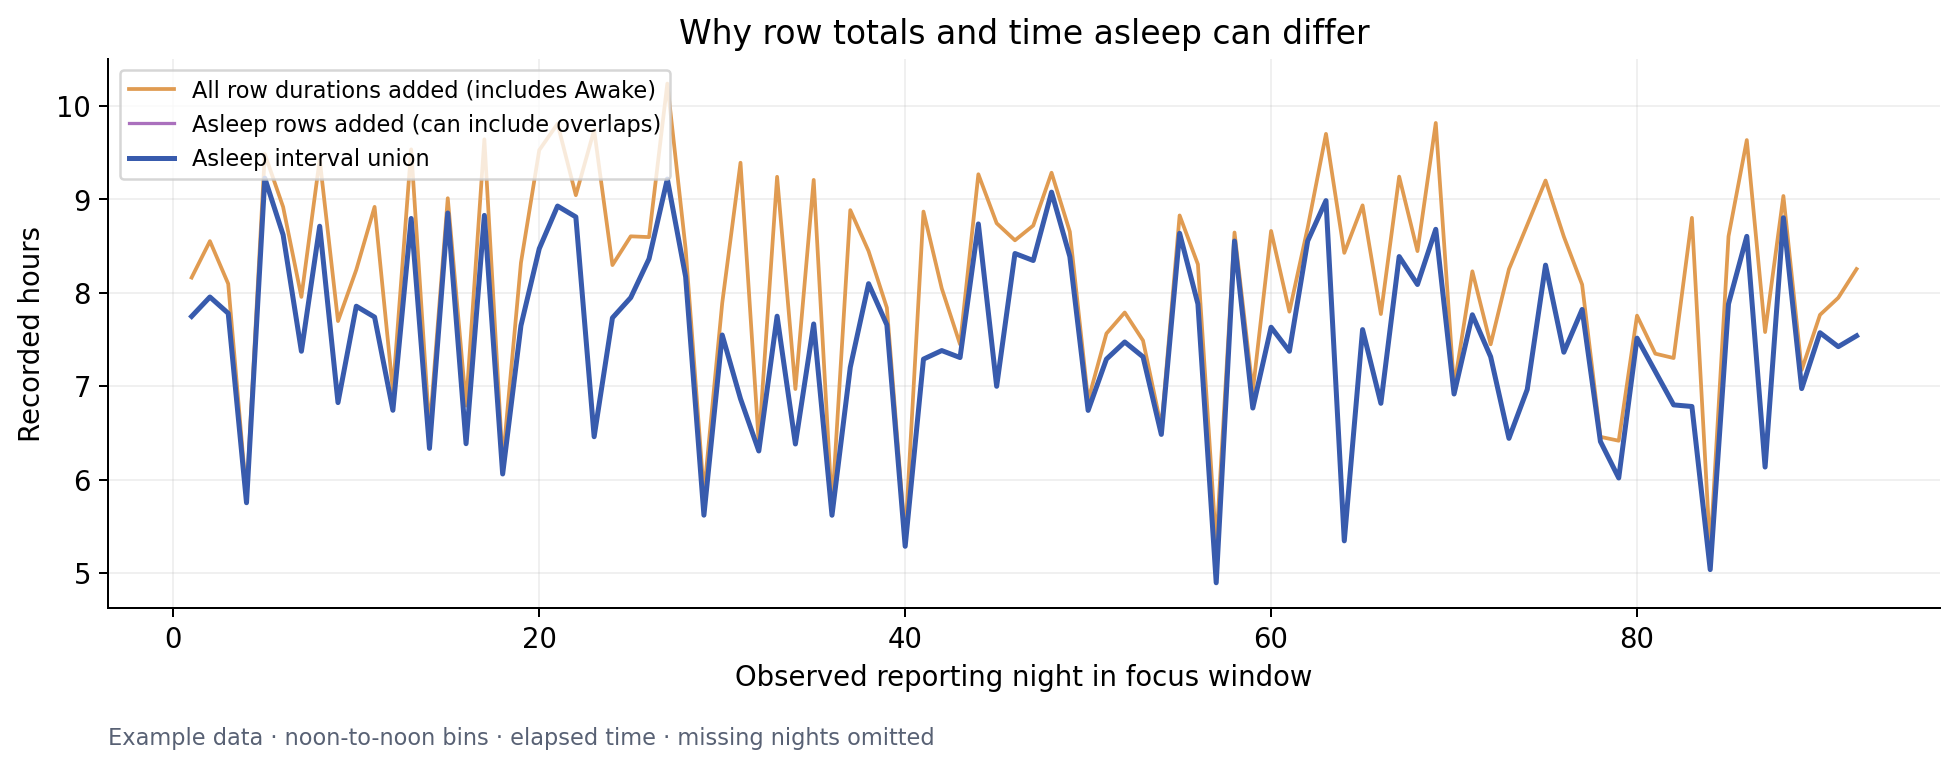
Why row totals and time asleep can differ
Example data, 92 recorded reporting nights. Asleep sums and union nearly coincide; adding Awake increases the apparent sleep total. These are observed values, not population norms.
View full-size figureHow this figure was made
Noon-to-noon reporting bins in a declared timezone; intervals split at noon and measured in UTC elapsed time. Asleep union uses values 1, 3, 4 and 5. Awake is excluded; In Bed was absent. Actual dates and source identifiers are omitted.
How should nights, missing data and outliers be handled?
A night crosses midnight, so grouping by sample start date can split it. This analysis used local noon-to-noon bins, labeled by their ending date, in one declared reporting timezone. Intervals crossing a bin boundary were split. Durations used UTC elapsed seconds, avoiding an extra or missing hour during daylight-saving transitions. First and last bins were excluded because the export could truncate their sleep episodes.
Noon bins may combine overnight sleep and daytime sleep. For questions about naps or sleep timing, also reconstruct episodes with an explicit gap rule; our exploratory analysis separated episodes after a gap greater than 90 minutes within a source. This is an analyst rule, not an identifier provided by HealthKit.
There were no zero-length, reversed or unknown-category rows. Statistical duration outliers were retained for review. A short recorded night might represent genuinely short sleep, incomplete capture, or a grouping boundary. Missing nights and gaps cannot establish non-wear, wakefulness or the absence of a physiological stage. Two Watch source groups and their software revisions were audited separately; apparent shifts can reflect a source or algorithm change.
How does sleep relate to heart rate, HRV and workouts?
Align heart rate and HRV observations to actual asleep intervals before comparing nights. In this dataset, a typical recorded night had about 107 heart-rate samples but only four HRV samples overlapping sleep. HRV is a sparse set of observations, so a nightly median does not describe every stage or every minute.
The analysis also compared respiratory-rate medians within asleep intervals, and matched workouts from the noon-to-noon window immediately before the sleep reporting bin. That workout window ends at noon before the night, so it excludes exercise later that afternoon or evening. Night-level sleep duration showed little linear association with the physiological medians in this example. This is a description of the selected records, not evidence that sleep cannot affect these metrics. Exercise, illness, timing, device behavior and recording density can confound comparisons; a workout record's absence does not establish inactivity.
What can these records tell you—and what remains uncertain?
Use consistent-source trends to explore sleep timing, recorded duration and estimated architecture. Keep personal observations distinct from medical guidance. Apple's classifier is based on accelerometer-derived signals and validated against polysomnography; its paper describes updates in 2024 and 2025 that can change longitudinal comparisons. The stored sleep intervals do not reveal a proprietary stage-detection rule based on an individual's HRV or respiratory samples.
If sleep feels unrefreshing, you have persistent difficulty sleeping, or someone notices breathing problems at night, discuss the symptoms with a clinician. A consumer stage chart cannot diagnose a sleep disorder or replace a clinical assessment. Sleep apnea events, where available on compatible systems, are a separate HealthKit concept rather than something inferred from these stage intervals.
Understanding your records
Recording frequency, source and coverage affect what you can conclude from this data. Read the recording guide.
- One record
- A category value describes a sleep state over an interval. Multiple intervals can form one sleep episode, so row count measures segmentation rather than number of nights.
- Frequency
- Intervals follow recorded states, not a fixed sampling schedule. Changes in stage segmentation or source behavior can change row counts without changing time asleep.
- Context
- Keep In Bed and Awake separate from asleep categories. Group intervals into episodes with an explicit rule for naps, gaps and the date assigned to an overnight episode.
- Coverage and gaps
- Count covered episodes or nights separately from calendar dates with interval starts. A night can cross midnight and the study boundary; missing stages are not evidence that a stage never occurred.
- Summaries
- Merge overlapping intervals within the chosen asleep categories before calculating total asleep time. Do not add In Bed to stage durations. Conflicting stages or sources require an explicit selection policy; a union alone does not resolve stage labels.
- Metadata
- Use timezone metadata when available and record the timezone used for night assignment. Source identity and software version help distinguish changes in recording from changes in sleep.
Recording guidance reviewed 2026-10-14