
Revised October 8, 2026; instructions reflect the current apps.
You can export your Apple Health data without a subscription or a server. Apple's built-in export gives you XML. For a spreadsheet, you can convert that XML locally or use an app that reads your selected Health data and writes CSV directly.
The important decision comes before the download: do you want every recorded measurement, or one useful number per day? A file containing every step-count sample is not the same thing as a table of daily steps. Choosing the right representation makes the rest much easier.
I build PulsHealth, so this guide includes its on-device export alongside Apple's built-in option. You do not need to sync to a PulsHealth database to export a file.
At a glance
Choose the row before you make the chart
How many steps each day?
- Daily aggregate
- One selected daily series
- Daily column chart
Keep the type, function, interval, and device filter consistent.
When was this measurement taken?
- Raw samples
- Timestamp + value + source
- Individual observations
Preserve the records. Adding overlapping sources does not recreate a daily Health total.
Choose the export that fits your question
| Your goal | Start with | Why |
|---|---|---|
| Keep an independent copy of Apple's export | Health's XML export | It preserves a broad export in Apple's format |
| Chart daily steps in a spreadsheet | A daily aggregate CSV | One bucket per day avoids manually combining raw device records |
| Inspect individual heart-rate readings | A raw-sample CSV | It retains the time and source of each reading |
| Analyze detailed metadata or replay a PulsHealth export | PulsHealth JSONL | CSV omits some fields and entire kinds of data |
A CSV is a text table. Excel, Numbers, and other spreadsheet tools can work with it, but it has no chart formatting or formulas until you add them. Save your finished analysis as a workbook to retain those additions.
Option 1: use Apple's built-in XML export
On your iPhone, open Health, tap your profile picture or initials, and choose Export All Health Data. Follow the sharing options to save or transfer the export. Apple documents this as an XML export, rather than a CSV or Excel workbook. Apple's export instructions
Keep the original export unchanged. Make a working copy for conversion, then decide which records you actually need. A step-count chart does not require uploading your complete history to a website.
Renaming an XML file to .csv does not convert it. XML represents structured records and attributes; CSV needs an explicit choice of columns and rows. A local converter should let you select a type, preserve timestamps and units, and retain the source name. If it silently turns all records into daily totals, establish how it handles overlapping sources before relying on the result.
If you are comfortable with Python, our Apple Health analysis tutorial provides a starting point for working with data programmatically. If your goal is simply a spreadsheet, exporting CSV directly is fewer steps.
Option 2: export CSV directly from PulsHealth
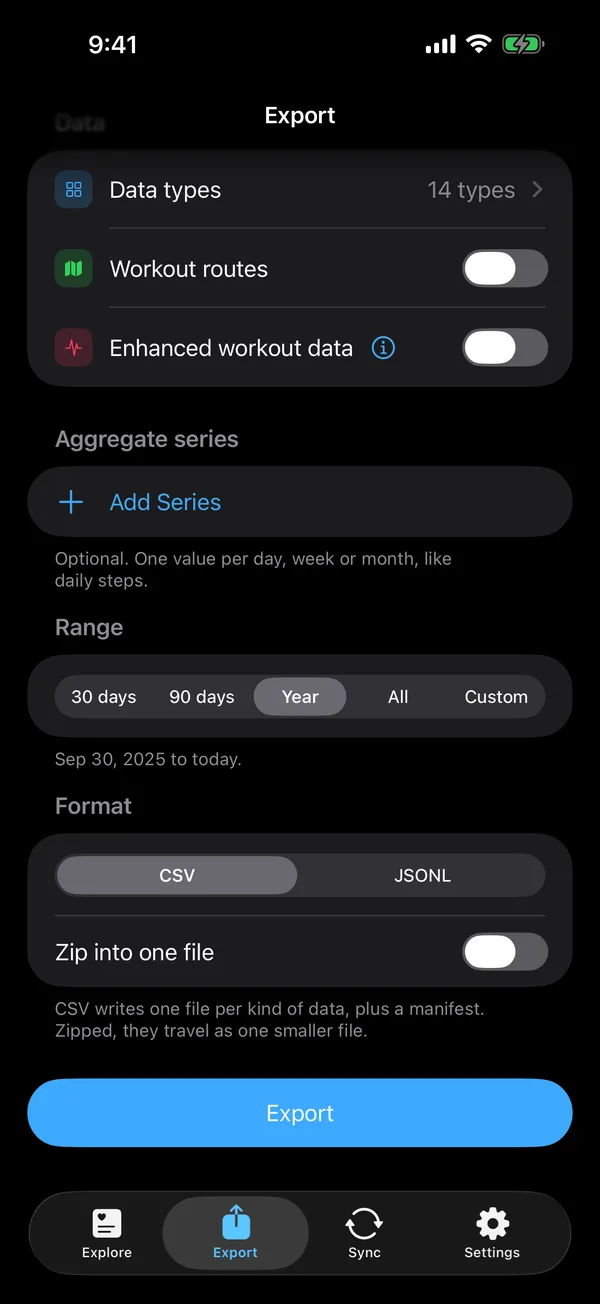
In the PulsHealth app, the Export tab reads HealthKit and creates files on the device. The export is separate from Sync: changing the export selection does not change what you sync to a database. The export reference documents the formats and their limitations.
For a first export:
- Grant read access to the types you want to export.
- Open Export and select a small date range, such as the last 30 days.
- For a daily steps chart, add Step Count under Aggregates and select its daily total. For individual measurements, choose the type under Raw Samples instead.
- Choose CSV. Turn on Zip into one file if you want one transfer containing the datasets and manifest.
- Run the export with the app open and phone unlocked.
- Read the result, then use Share or Save to Files. Save it before starting another export.
The app stages exports temporarily and removes its staged copy after sharing or at the next launch. Your saved destination is the lasting copy. If you save to a cloud-synced folder, that provider receives the file even though producing the export itself did not require an upload.
Check whether the result is marked incomplete. The accompanying manifest records the requested range, time zone, selected types, row counts, and reported failures. It helps distinguish an interrupted export from a small dataset. A successful read still cannot establish that every expected measurement exists: compare against Health if the history looks unexpectedly short.
Date ranges have an exclusive end. To export all of September, select September 1 through October 1. A daily aggregate that would cross the end is excluded instead of presented as a complete day.
Open the right CSV
PulsHealth creates a separate CSV for each dataset containing rows. These files answer different questions:
samplescontains individual quantity and category records. It includes type, unit, start and end times, value, and source.aggregatescontains the configured statistical series. It includes the type, function, interval, device filter, bucket boundaries, value, and unit.workoutscontains workout records, including duration, distance, and energy where available.activitycontains daily activity-ring values and goals.
The on-device export does not contain the server's daily_metrics or sleep datasets. Those are computed server views. On the phone, daily quantity summaries are aggregates; sleep-stage records are samples. This distinction matters when following examples written for the server API.
For aggregates, filter to one type, function, interval, and device filter before charting. Otherwise, a file containing daily and weekly steps or several device-specific series can appear to have duplicate dates.
Build a first chart in Excel
Use this synthetic example CSV to practice. It is an illustrative daily table, not a raw PulsHealth export and not anyone's health history:
| date | steps |
|---|---|
| 2026-05-01 | 6420 |
| 2026-05-02 | 8150 |
| 2026-05-03 | |
| 2026-05-04 | 7340 |
In desktop Excel, use Data → From Text/CSV, or the equivalent import command for your version. Select comma as the delimiter and inspect the preview. Microsoft recommends this import route when you need control over how text-file columns are interpreted. Microsoft's CSV guide
Import date as a date or as text in the displayed YYYY-MM-DD format, and steps as a number. Select the two columns and insert a column chart. Label it “Daily steps — synthetic example” and leave the missing day blank. Check the chart's empty-cell settings if it displays that day as zero.
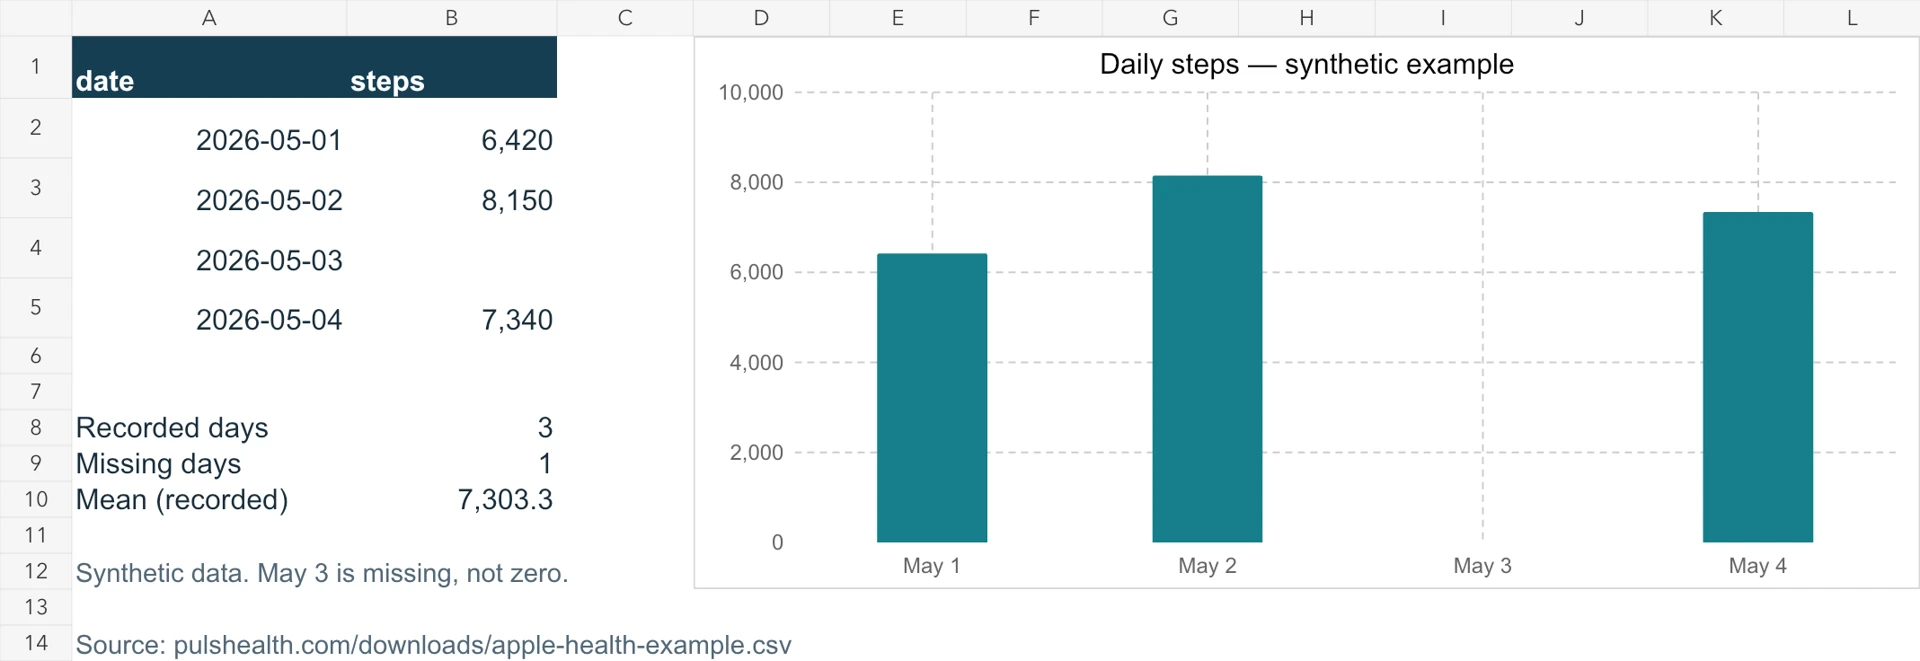
Download the finished Excel workbook to inspect the chart and formulas. Cells A1:B5 match the practice CSV. The supporting chart labels are below the summary; the empty input stays empty.
For the three observed days, =AVERAGE(B2:B5) returns approximately 7,303 steps. Dividing their sum by four returns 5,477.5, a different result that implicitly treats the missing day as zero. Neither number should be called a four-day measured average without explaining the missing observation.
In a real aggregate export, use the filtered series' bucket start for the horizontal axis and value for the vertical axis. PulsHealth timestamps are Unix milliseconds. In Excel's usual 1900 date system, this converts an instant in cell A2 to a UTC date-time:
=DATE(1970,1,1)+A2/86400000Format the result as a date-time. That formula does not convert UTC into your local time zone. Keep the export's time-zone context when assigning local days; subtracting a fixed offset across a daylight-saving transition can mislabel them.
Three checks before trusting the chart
Do not add overlapping sources blindly. Apple Health prioritizes data sources, and raw exports can contain records from both your iPhone and Watch. A spreadsheet sum does not automatically reproduce Health's total. Use an appropriate aggregate, or investigate the overlaps as explained in why step counts do not match. Apple's source-priority explanation
Keep missing values separate from zero. PulsHealth CSV uses an empty cell for a null value. “No reading available” and “measured zero” make different statements.
Keep units and provenance. Record the export date, selected range, time zone, type, and aggregation. Preserve source text as text during import: a spreadsheet may interpret a source name beginning with a formula character as a formula.
Start with one metric and a short range. Once the values agree with the question you meant to ask, expand the history or move on to viewing your data on a Mac or PC.