
A useful first Apple Health analysis should answer a question you can explain without mentioning Python: how consistently am I recording workouts, how much sleep is recorded, and what does my resting heart rate look like across the month?
You do not need a predictive model to answer those questions. You need three well-defined datasets, a calendar, and a decision about what an absent record means.
This tutorial produces three charts from PulsHealth's product API CSV exports. The downloadable files contain entirely synthetic data, so you can run every step without sharing or even exporting your own records. They demonstrate file structure and missing-data handling, not normal health ranges or a real person's results.
Current revision: October 8, 2026. Download formats and commands below reflect the current PulsHealth export contract.
Run the example first
Download these five files into one folder:
Use Python 3.10 or later. Open a terminal in that folder, create an environment, and install the plotting dependencies:
python3 -m venv .venv
source .venv/bin/activate
python -m pip install -r requirements.txt
python analyze.py --time-zone UTC
On Windows, activate the environment with .venv\Scripts\activate instead. The script saves figures/three-charts.webp and figures/daily-summary.csv. Its default window is August 3–30, 2026, inclusive: the supplied --end date of August 31 is exclusive.
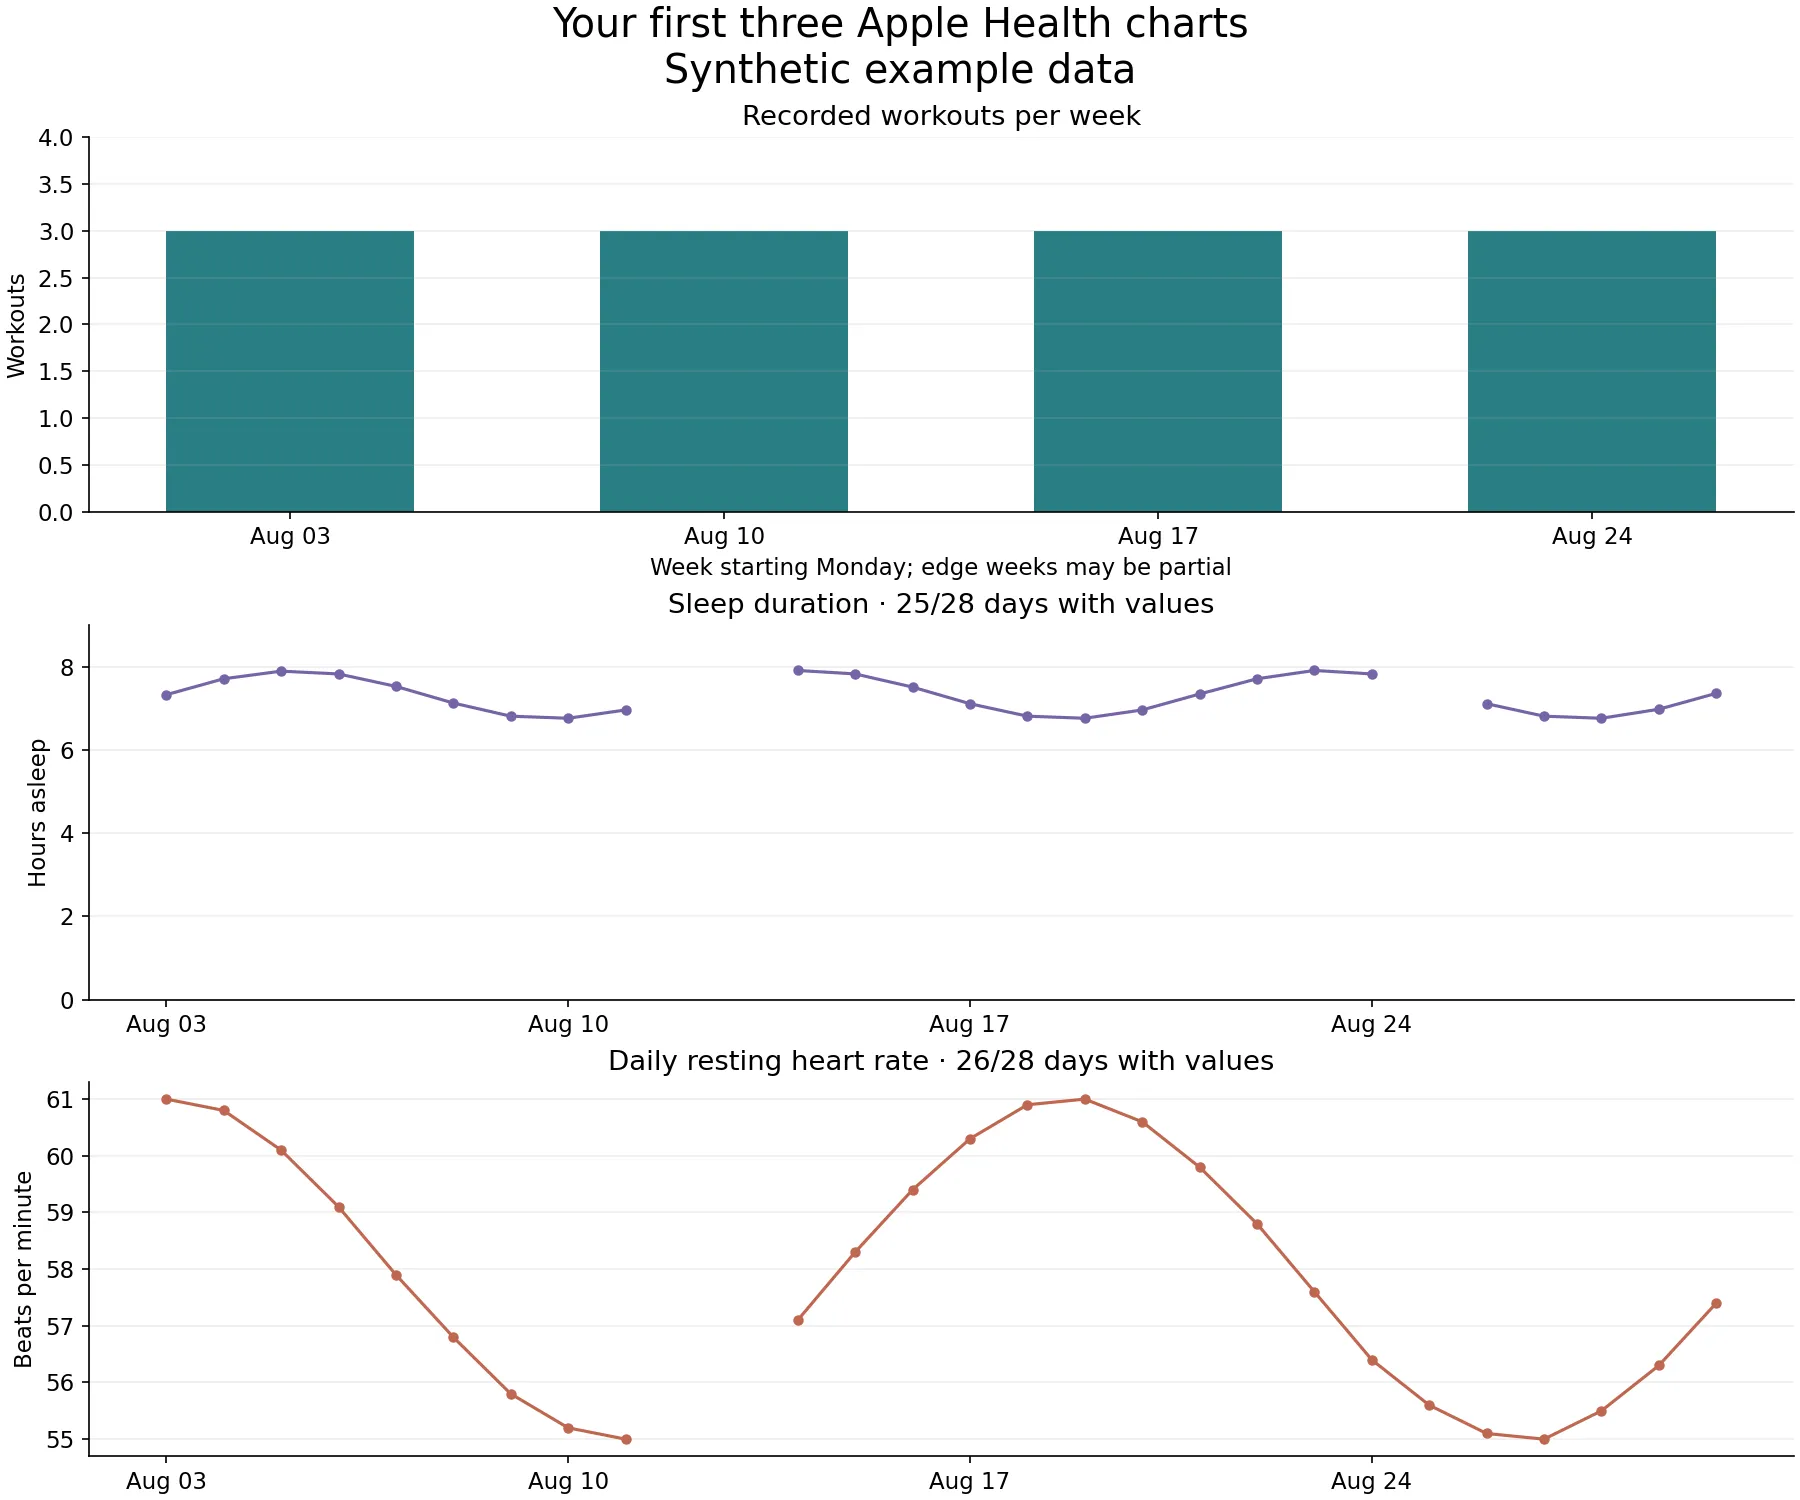
The example run reports 12 workouts, 25 days with sleep values, and 26 days with resting-heart-rate values across 28 calendar days. These counts are useful checks that you downloaded and processed the intended files.
Know which export you have
Apple Health's built-in export, PulsHealth's on-device files, and the PulsHealth product API are different inputs. This script expects the product API's workouts, sleep, and daily_metrics datasets. It is not an XML parser, and renaming Apple's XML file to CSV will not make it compatible.
The export reference defines the columns. Three distinctions matter here:
| Dataset | What one row means | Field used |
|---|---|---|
workouts | One recorded workout | uuid, start |
sleep | A derived local-day sleep summary | date, asleepMinutes |
daily_metrics | One daily value for one metric | identifier, unit, date, value |
Workout instants use epoch milliseconds. Sleep and metric dates already represent calendar days in the server's configured time zone. An empty numeric CSV cell means missing data; it does not mean zero.
The daily sleep summary is a derived view, not a list of individual sleep-stage intervals. Keep its assigned date. Rebuilding a night by summing every raw sleep interval introduces additional questions about sources, overlaps, naps, and intervals crossing midnight.
Chart one: count recorded workouts
The script converts each workout start into the chosen time zone, takes its local calendar date, and counts records in Monday-starting weeks. Pandas documents the explicit unit and utc arguments used when parsing timestamps.
local = pd.to_datetime(
    workouts.start, unit="ms", utc=True
).dt.tz_convert(args.time_zone)
workout_days = local.dt.tz_localize(None).dt.normalize()
That conversion comes before grouping. Otherwise, an evening workout can land on the following UTC date and, near a week boundary, in the wrong week.
We count workout UUIDs, not minutes of elevated heart rate. A walk without a recorded workout does not enter this chart. Two apps may also record the same session using different UUIDs. The script rejects duplicate UUIDs, but it cannot decide whether two distinct records describe one real activity. Inspect suspiciously close start times before interpreting a sudden jump.
A bar of zero means no exported workout records in that part of the window. It does not prove there was no exercise, nor that syncing and permissions were complete. The first or last week can also be partial when you change the date range. Compare complete weeks when assessing consistency.
Chart two: preserve missing sleep
The sleep plot divides asleepMinutes by 60 and reindexes onto every date in the requested range. Reindexing introduces missing values for absent dates, so the line breaks instead of inventing a zero-hour night.
The figure includes coverage in its title: 25 of 28 days have values. That denominator should travel with any summary you write. “Average recorded sleep across 25 days” says something different from “average sleep across the month.”
Do not fill gaps by carrying yesterday's sleep forward. The purpose is to describe the recorded nights. A gap might arise from not wearing the watch, a charging interruption, missing permissions, or an incomplete export; the CSV alone does not identify the cause.
Also resist interpreting this chart as a sleep-quality score. It shows duration from the exported summary. It does not establish how restorative sleep was or diagnose a sleep condition.
Chart three: use the resting-heart-rate metric
The script selects HKQuantityTypeIdentifierRestingHeartRate and requires the canonical count/min unit. That is beats per minute. It does not calculate “resting heart rate” by averaging all ordinary heart-rate samples, which would mix workouts, movement, and rest.
The daily metric is itself a summary. PulsHealth's database guide explains that canonical HealthKit daily aggregates take precedence, with a defined rollup fallback when an aggregate is absent. That distinction matters when reconciling an exported value with another app's display.
This first chart leaves daily observations visible and unsmoothed. A rolling average could be a useful second view, but it also raises a choice about the minimum number of observations in each window. Start with the data and its gaps before adding a trend line.
Replace the example with your records
With a configured PulsHealth server and the puls-export CLI, save the corresponding files into a separate directory. Set PULS_API_URL and PULS_API_TOKEN in your local environment according to the export instructions. Keep credentials out of scripts and notebooks.
mkdir my-data
puls-export --dataset workouts --start 2026-08-03 \
  --end 2026-08-31 --time-zone Europe/London -o my-data/workouts.csv
puls-export --dataset sleep --start 2026-08-03 \
  --end 2026-08-31 --time-zone Europe/London -o my-data/sleep.csv
puls-export --dataset daily_metrics \
  --types HKQuantityTypeIdentifierRestingHeartRate \
  --start 2026-08-03 --end 2026-08-31 \
  --time-zone Europe/London -o my-data/daily_metrics.csv
python analyze.py --input my-data --output my-figures \
  --time-zone Europe/London --start 2026-08-03 --end 2026-08-31 \
  --label "Personal recorded data"
Replace Europe/London with your server's PULS_TIME_ZONE in all four commands. The CLI time zone interprets date bounds; it does not redefine the server's daily-summary dates. Matching them keeps your workout grouping aligned with the exported days.
Before drawing conclusions, open daily-summary.csv and inspect a few days against the original files. Check a day with a workout, a missing day, and a date near a boundary. If a dataset is empty, first investigate coverage and configuration. Do not turn an empty chart into a health conclusion.
The useful outcome is a small analysis you can explain and rerun: which files it read, which dates it included, how it counted records, and where it had no information. Once that is dependable, more interesting questions become possible.