By PulsHealth. Updated
Real data exampleResearch reviewed . Figures use example Apple Health data.
What does running vertical oscillation measure?
Vertical oscillation describes the up-and-down movement of your body during running. A reading of 11 cm means a vertical movement estimate of that size; it does not tell you how far forward you travelled or how many steps you took. HealthKit defines the type using pelvis movement, while Apple Watch describes it as torso movement. Apple's HealthKit reference documents discrete length samples and automatic collection during outdoor runs on supported watches.
Use it as one part of your running record. Pace, stride length and ground contact time help explain the same number in different situations. There is no universal Apple Health clinical threshold that makes a particular bounce measurement “good form” or “poor form.”
What range appeared in real Apple Health data?
In the example July–September 2026 records, 5,729 observations across 13 runs had a median of 11.6 cm. The middle 90% were 10.2–12.8 cm; the full retained range was 8.8–14.2 cm. These are an example of recorded variation, not recommended targets or a population reference interval.
| Summary | What it tells you |
|---|---|
| Median: 11.6 cm | The centre of the stored observations |
| 5th–95th percentile: 10.2–12.8 cm | The central spread, while keeping extremes visible |
| Minimum–maximum: 8.8–14.2 cm | Every observed value, including tails |
| Individual run medians: 10.9–12.1 cm | Runs differed within the example data |
Longer or more densely recorded runs contribute more samples to the histogram. Giving each run equal weight answers a different question from pooling every stored observation. Across the full year, a descriptive outlier rule flagged 24 observations; all were retained. An unusual value is a prompt to inspect its context, not proof of a sensor error or injury.
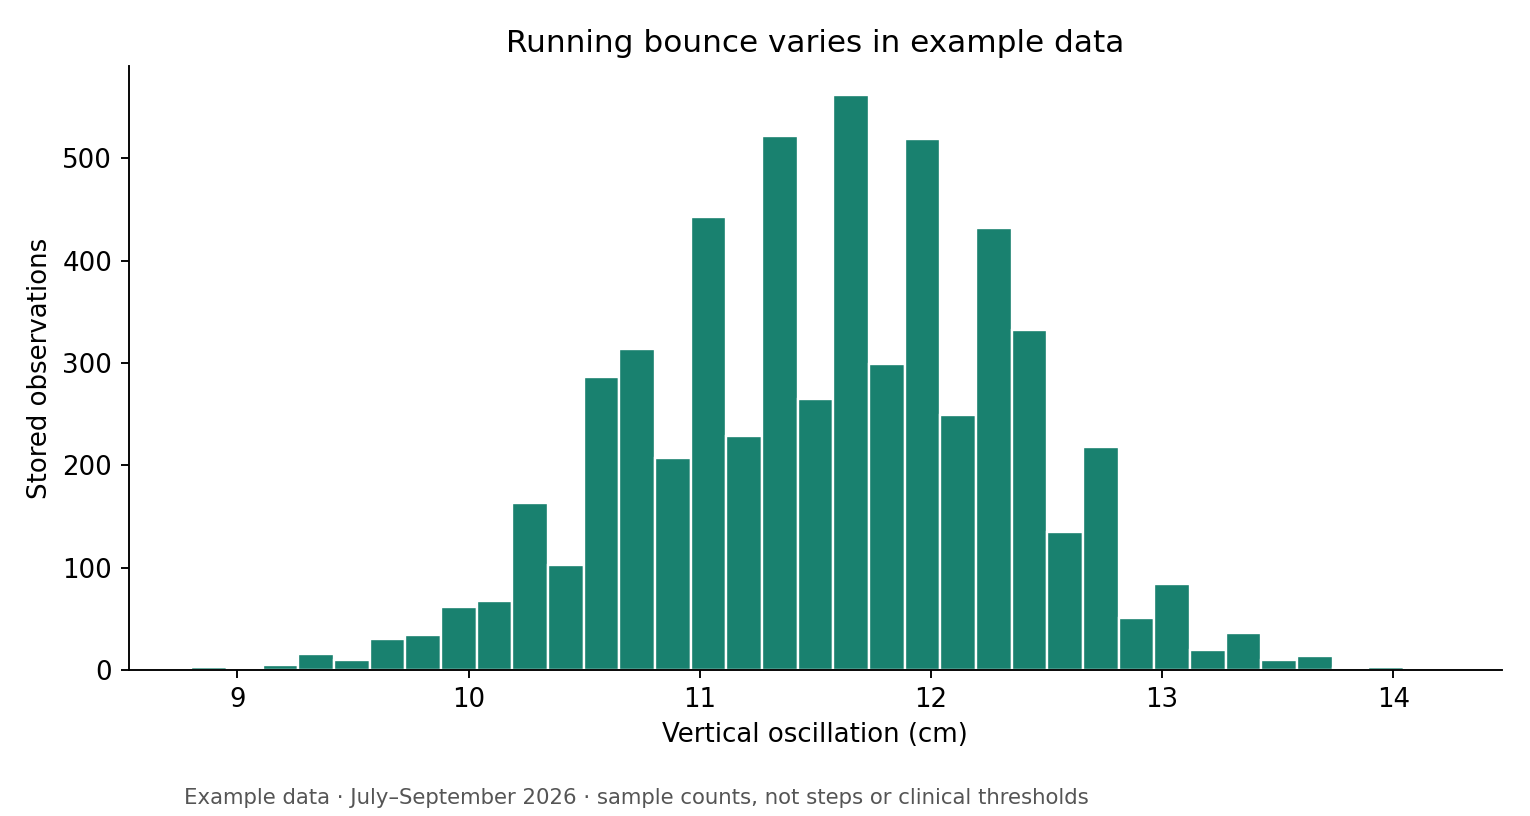
The spread behind a running average
Example data, 13 runs in July–September 2026. All observed values are retained; the chart shows sample counts, not steps or recommended ranges.
View full-size figureHow this figure was made
Raw quantity observations in centimetres, selected by start timestamp in America/Los_Angeles. Longer runs contribute more samples.
How often does Apple Health record it?
In this quarter, the median interval between sample starts was about 5.13 seconds. Every stored sample had the same start and end timestamp. That makes them point observations in the database, not proof that each reading represents exactly one stride or that motion was measured only at that instant.
The earlier months contained fewer, longer intervals. Across the annual extract, 6,366 of 6,529 records were points and 163 covered nonzero intervals. Apple's documentation says workout data may be condensed or coalesced. The observed change in record shape does not establish which device, sync or HealthKit behaviour caused it. Comparing sample counts across those months as if they measured training volume would be misleading.
Cadence between stored records is also different from running cadence, meaning steps per minute. A five-second sample interval cannot tell you your step cadence. Days without this type are gaps in the recording, not zero bounce.
How does it change within a run?
The example figure follows one run using elapsed workout minutes. Bounce and pace vary within the same session; an average hides that variation. Speed samples in this example matched oscillation timestamps exactly. Pace is calculated from metres per second, so a lower minutes-per-kilometre value means faster running.
For comparisons, start with the same person and similar pace, surface and recording source. In the quarter's observations, median bounce was 11.7 cm at both 5–6 and 6–7 min/km, and 11.3 cm at 7–8 min/km. These groups mix runs and conditions; they do not isolate speed's effect.
A separate comparison matched first and last workout quarters within the same run and pace band, requiring at least ten observations in each part. Changes went in both directions. A late-run increase alone therefore cannot diagnose fatigue. Grade, pauses, effort and sensor estimation still matter, and the figure uses wall time rather than subtracting pauses.
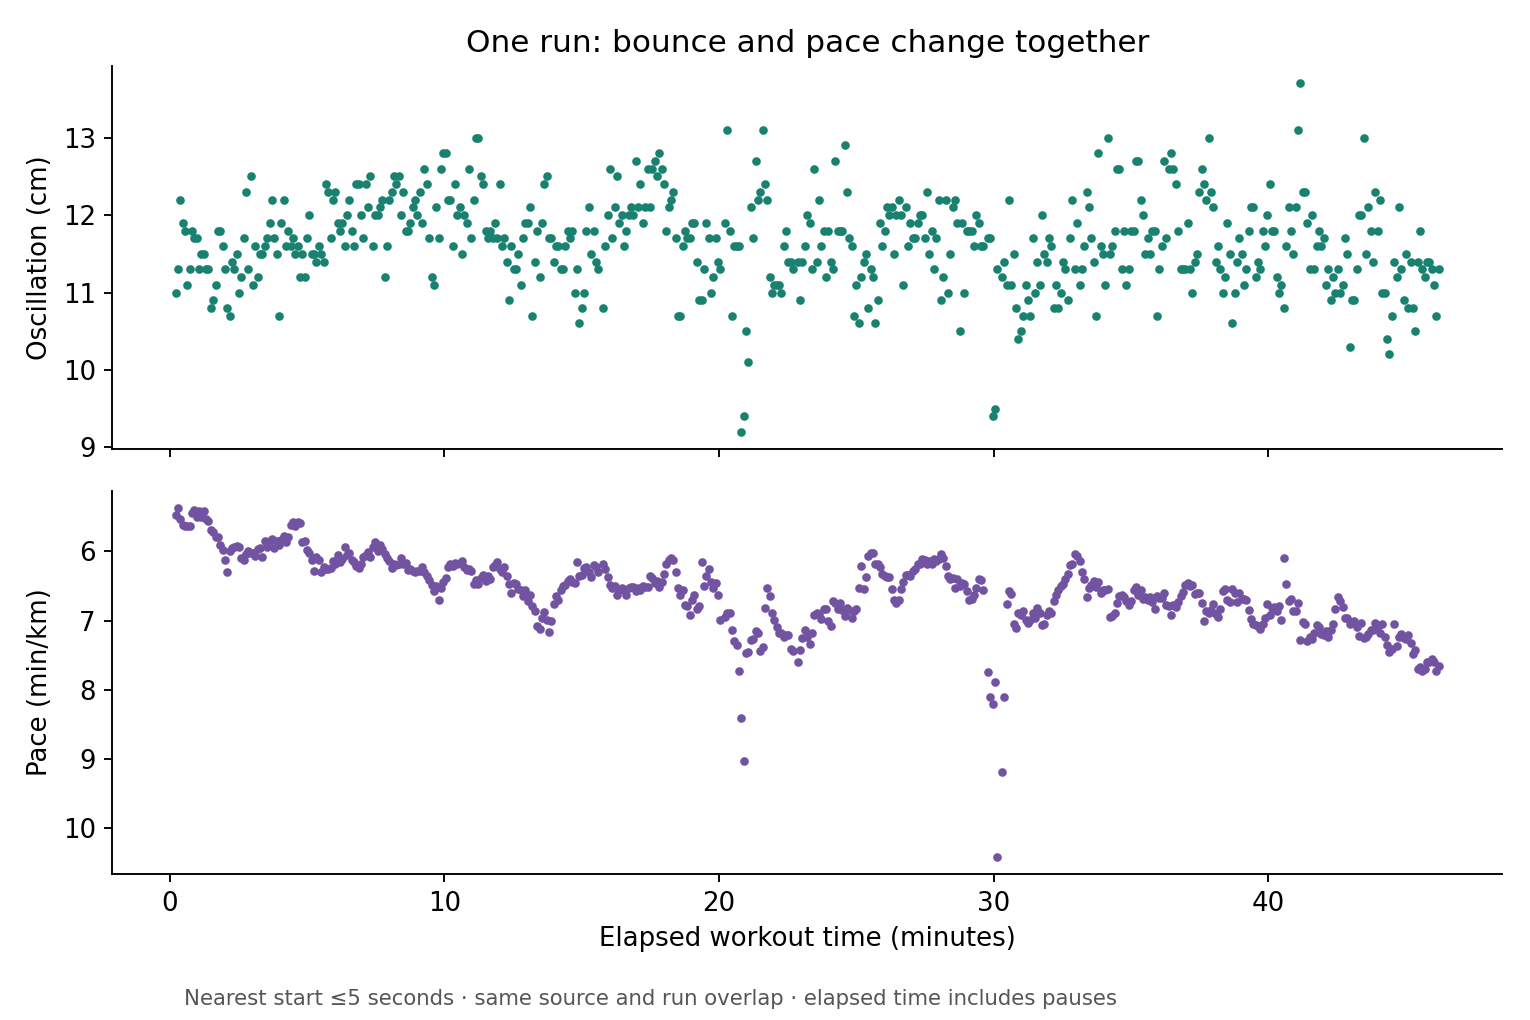
A run has more detail than its average
A single run selected for the most matched observations in the quarter: 534 pairs. Pace and bounce vary during the session; neither plot diagnoses fatigue or efficiency.
View full-size figureHow this figure was made
Nearest starts within five seconds, same source group and uniquely overlapping run. These speed matches had identical timestamps. Elapsed time includes pauses.
Which other measurements help explain it?
Running speed gives the pace context. Stride length describes forward distance, and ground contact time adds information about the time spent on the ground. Heart rate can supply an effort-related signal, although it does not measure running economy.
You can calculate a vertical ratio as 100 × vertical movement ÷ stride length, after converting both lengths to the same unit. It changes when either input changes and does not remove all speed or body-size differences. This research paired nearby observations within five seconds, within the same uniquely overlapping run and source group. Pairing reduces obvious timing mismatches but does not make correlations causal.
All oscillation sample starts in this annual extract overlapped a recorded running workout. None overlapped recorded asleep intervals. This dataset therefore supports running examples, but supplies no sleep or everyday-activity baseline for the metric.
Does less bounce mean better running economy?
Running economy concerns the energy or oxygen cost of running at a given speed. A study of 97 endurance runners examined biomechanics alongside measured energy cost during treadmill running. Its observational findings do not turn a wrist-based reading into an economy test or establish an ideal centimetre threshold for everyone.
Treat trends as questions to investigate. If your values change at similar pace, check the source, interval shape and other running metrics before attributing the change to fitness or technique. This example dataset has no controlled oxygen-consumption measurements, route-grade analysis or injury outcomes to support those conclusions.
Technical reference and analysis limits
HKQuantityTypeIdentifierRunningVerticalOscillation is a discrete quantity type. PulsHealth stores its canonical unit as centimetres; use averages or distributions rather than adding samples together. HealthKit may condense workout samples, so inspect both start and end timestamps. The research keeps raw quantities separate from workout-series representations instead of counting both as additional observations.
The example uses a fixed America/Los_Angeles reporting calendar, an annual October 2025–September 2026 extract and a July–September focus. Workout and sleep context are time-overlap checks, not explicit HealthKit sample associations. Context records beginning before the extract boundary are unavailable. Source names and revisions cannot prove persistent device identity. Private notebook outputs retain provenance, validity checks, cadence, source changes and unsupported questions; the figures omit dates, identifiers and routes.
Understanding your records
Recording frequency, source and coverage affect what you can conclude from this data. Read the recording guide.