
By PulsHealth. Updated
Real data exampleResearch reviewed . Figures use example Apple Health data.
What does Environmental Audio Exposure measure?
Environmental Audio Exposure is an estimate of surrounding sound, expressed in A-weighted decibels, dB(A). The stored canonical unit is dBASPL. This is a level summarized over an interval, rather than an audio recording or a count of loud sounds. Apple’s type documentation describes equivalent continuous sound-level samples.
What do example records look like?
The reporting year contained 18,201 records across two source groups. The source with the most July–September records contributed 2,411 intervals on all 92 days. Its median level was 70.0 dB(A); the middle half ranged from 61.5 to 74.8, and the full observed range was 35.1 to 99.6 dB(A). These are example sample distributions, not a healthy range or a full-day exposure assessment.
| Feature | Example | Interpretation |
|---|---|---|
| Stored interval duration | 5 seconds to about 30 minutes | An interval summary can conceal short peaks |
| Median interval duration | About 30 minutes | Export cadence differs from microphone sampling |
| Workout overlap | 225 records | Temporal context, not proven activity-caused noise |
| Recorded-sleep overlap | 44 records | Does not characterize every night |
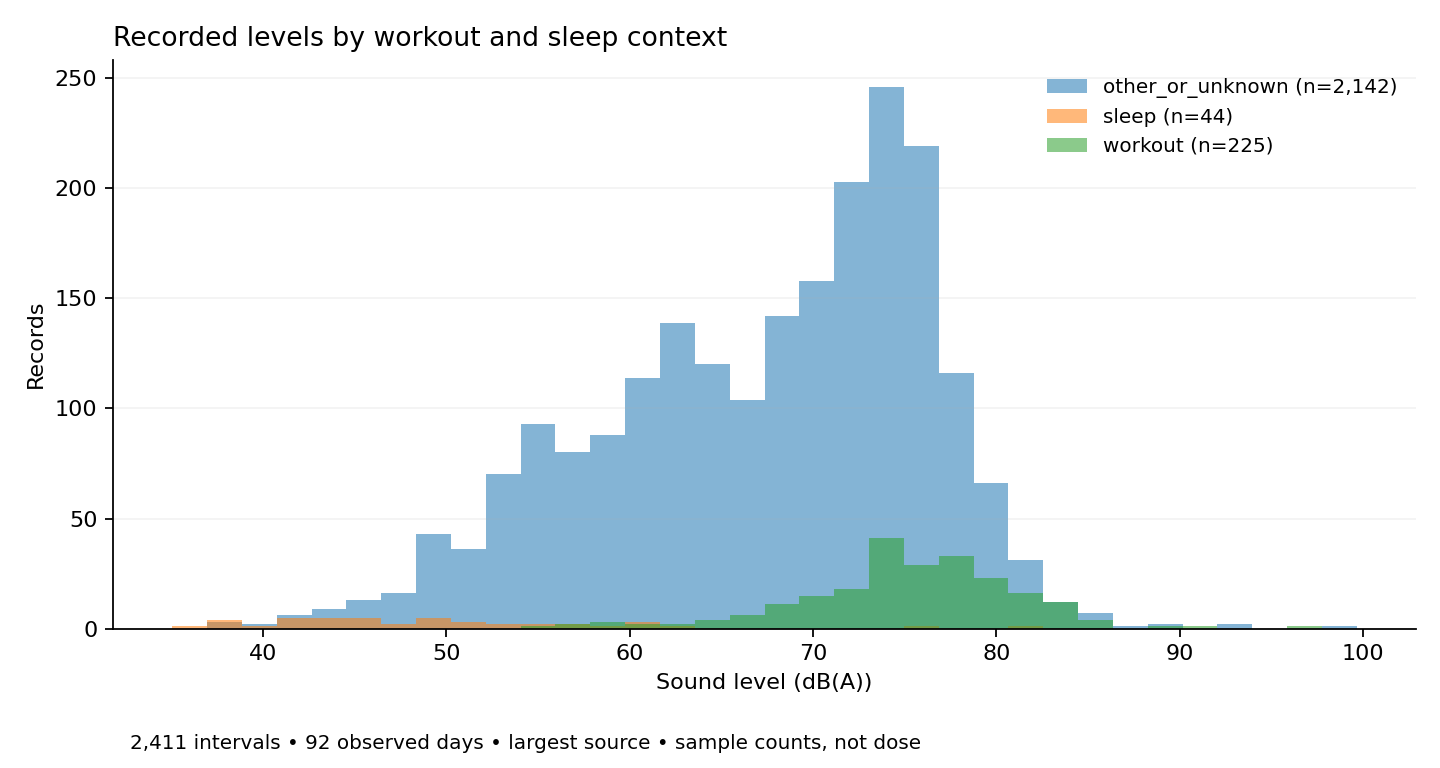
Environmental Audio Exposure: observed distribution
Example July–September 2026 records (2,411 intervals) from the source group with the most observations. Sample-count weighting, not duration-weighted exposure or a hearing dose. Context groups can have very different coverage.
View full-size figureHow this figure was made
Half-open reporting window, intervals selected by start in America/Los_Angeles. Source bundle identifier plus display name, combining revisions; sources kept separate. Overlap with recorded workouts takes precedence over recorded asleep intervals; other records labeled other or unknown. Boundary intervals retained without prorating.
Why is a simple decibel average misleading?
Decibels use a logarithmic scale. Combining equivalent sound levels requires converting them to sound energy, weighting by covered duration, then converting back. An arithmetic mean of sample dB values can understate the contribution of louder intervals. Equal weighting also treats a five-second sample like a thirty-minute one.
Even an energy-based calculation needs suitable coverage. The selected source had 1,224 intervals beginning before the preceding running maximum end, including very small timestamp overlaps. These were retained for investigation rather than counted as independent monitored time. Multiple sources and overlapping summaries cannot simply be added into a daily dose. The research keeps source groups separate and does not publish a reconstructed exposure budget.
Does recording change during workouts or sleep?
The two source groups had strikingly different context coverage: one supplied 1,539 sleep-overlapping records and five workout-overlapping records, while the other supplied 44 and 225, respectively. Combining them would hide those differences. A change in apparent sound distribution may reflect when a source is present, rather than a change in the environment.
Apple’s Noise app guidance explains that measurements are periodic while the watch is worn, can be affected by water or wind, and pause during Water Lock or microphone/speaker use. A quiet-looking swimming workout or a long recording gap therefore requires coverage review. Intervals that cross a sleep or workout boundary are assigned by overlap; they are not split into separate sound measurements.
How does this relate to headphone sound and noise alerts?
Headphone Audio Exposure describes playback exposure, while this stream describes surrounding sound. Asynchronous levels from different positions cannot be summed into total ear exposure. Audio Exposure Event is a named notification category; its count is neither a noise level nor a dose.
What should be checked before interpreting a high value?
Review duration, source, overlapping records and the recording context. A brief high observation and repeated long intervals answer different questions. Statistical outlier flags identify unusual records within this example; they do not establish hearing injury. There is no hearing test, symptom assessment or complete monitored-time denominator in these records.
Understanding your records
Recording frequency, source and coverage affect what you can conclude from this data. Read the recording guide.