By PulsHealth. Updated
Real data exampleResearch reviewed . Figures use example Apple Health data.
What is BMI in Apple Health?
Body Mass Index relates weight to height: weight in kilograms ÷ height in meters². HealthKit stores the BMI number using count units; 28.4 is a BMI value, not 28.4 measurements or a percentage.
A scale app may calculate and write BMI alongside weight. The existence of a BMI record does not reveal which height the app used or establish that a separate height record exists in HealthKit.
What BMI ranges mean
BMI is a screening measure. It cannot separate fat from muscle or show fat distribution; interpret it alongside the broader health assessment. CDC explains these limitations.
| Adult screening category, ages 20 and older | BMI, kg/m² |
|---|---|
| Underweight | Below 18.5 |
| Healthy weight | 18.5 to below 25 |
| Overweight | 25 to below 30 |
| Obesity | 30 or higher |
These are CDC adult categories, not a diagnosis from a stored reading. Children and teens require age- and sex-specific BMI percentiles rather than this table.
How often does BMI update?
The example has 218 BMI records on 211 of 365 reporting days, all from one source group. Each is instantaneous. The median positive gap was 1.00 day, with a 95th percentile of 4.24 days and a longest gap of 13.05 days. The schedule matches the main weight source: no new weigh-in generally means no new BMI observation.
The figure preserves gaps and shows 30-day-bin medians beside recorded values. It does not draw a daily BMI estimate for days without observations.
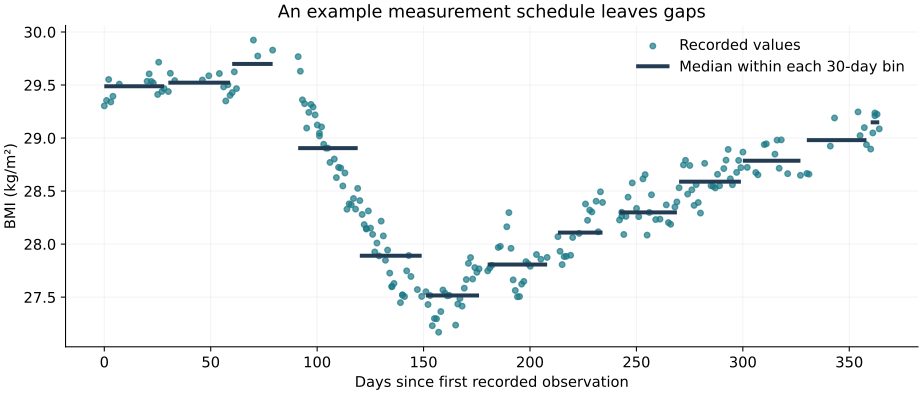
Observed measurements leave unmeasured days
Example data from the main scale-app source: 218 instantaneous records on 211 reporting days. Points retain repeat measurements; median segments describe only observed records in each bin.
View full-size figureHow this figure was made
Select the highest-record-count source group (bundle plus display name) within the full reporting year. Plot every selected observation against elapsed days since its first start timestamp. Compute medians in non-overlapping 30-day elapsed-time bins and draw each segment only between that bin’s first and last observed timestamps. Do not fill missing days or join bins. No source names, absolute dates or record identifiers are shown.
What did the example values show?
The full-year range was 27.17–29.92, with a median of 28.41. The 92-day focus window contained 48 records on 47 days, spanning 28.29–29.25. All year records fell numerically within the adult 25-to-below-30 band, but this does not establish age applicability or an individual diagnosis. These distributions describe user data, not population reference intervals.
No values were zero, negative or non-finite, and the source-level descriptive IQR check flagged none. That check identifies unusual values within this dataset; it cannot verify the height setting, calibration or clinical meaning.
Can weight and height validate BMI?
Every BMI record matched a positive weight observation at exactly the same start time and source group: 218 unique pairs, with no ambiguous same-source timestamp duplicates. Computing the height implied by each pair produced almost the same result throughout the year, consistent with a fixed denominator.
No raw height records were available within the year. This is a mathematical consistency check rather than a verified measurement of stature or proof of how the source calculated BMI. If BMI changes unexpectedly while weight stays similar, check the source app's height setting, units and dates before attributing the difference to body composition.
Why might BMI be missing when weight is present?
Missing BMI can coexist with present weight if an app writes only weight or lacks the inputs needed to calculate BMI. Check the producer's settings and Health sharing permission. Body Fat Percentage supplies a different measurement when available; it cannot be inferred from BMI alone.
Understanding your records
Recording frequency, source and coverage affect what you can conclude from this data. Read the recording guide.
- One record
- A discrete body measurement written by the producing app; source and measurement conditions govern interpretation.
- Frequency
- Measurement or logging cadence, without a fixed HealthKit-wide schedule. Repeated entries are not necessarily independent measurements.
- Context
- Interpret the value alongside its documented height and weight inputs; matching timestamps alone do not verify how a source calculated BMI.
- Coverage and gaps
- The year snapshot contains 218 raw records. Missing days or an absent type remain unavailable, not zero measurements.
- Summaries
- Use source-specific trends or a recent observation. Summing a discrete body measurement is not meaningful; sample averages can overweight repeated sessions.
- Metadata
- Producer metadata may identify manual entry or import identifiers. Metadata does not independently verify device calibration or the calculation method.
Recording guidance reviewed 2026-10-14
Reference ranges
These source-specific ranges provide context; they are separate from the personal values in any data examples and do not diagnose a condition.
Adults ages 20 and older (CDC screening categories)
- low
- Below 18.5: underweight
- normal
- 18.5 to below 25: healthy weight
- high
- 25 to below 30: overweight; 30 or higher: obesity
Screening categories, not individual diagnoses. BMI does not distinguish fat from muscle or fat distribution. Children and teens require age- and sex-specific percentiles.
| Population | low | normal | high |
|---|---|---|---|
| Adults ages 20 and older (CDC screening categories) Screening categories, not individual diagnoses. BMI does not distinguish fat from muscle or fat distribution. Children and teens require age- and sex-specific percentiles. | Below 18.5: underweight | 18.5 to below 25: healthy weight | 25 to below 30: overweight; 30 or higher: obesity |