
A useful health dashboard should tell you more than whether a line went up. It should tell you whose data you are seeing, how a daily number was calculated, and whether new records are still arriving.
This guide builds a small Grafana dashboard around those questions. It uses the PulsHealth reference stack: the iPhone app reads Apple Health, the ingest service stores records in PostgreSQL with TimescaleDB, and Grafana queries the database through a read-only role.
The downloadable dashboard has four panels: daily steps, individual workout durations, the source of each daily step value, and hours since the last received upload. Keeping the first version small makes it easier to check against the phone before adding more metrics.
Current revision: October 8, 2026. The template targets the current PulsHealth database and provisioned Grafana datasource. Queries were checked against synthetic PostgreSQL fixtures and a private owner-scoped production database; see the download README for validation scope.
At a glance
Four panels, four different questions
Daily steps + provenance
- Daily summary
- Value and calculation source
- Compare a known day
Keep aggregate versus rollup visible beside the daily value.
Recorded workout duration
- One workout record
- Duration in minutes
- One plotted point
A record is a session, not a continuous exercise signal.
Upload freshness
- Latest received batch
- Hours since receipt
- Check the target metric too
A fresh upload can contain old measurements. Receipt age is not a completeness score.
Start with a working private stack
Follow the maintained server setup guide for installation, phone pairing, credentials, and network configuration. Let the phone sync some records before designing panels. Grafana cannot discover information that has not reached the database.
The reference stack already includes Grafana dashboards. This tutorial adds a smaller, editable dashboard so you can understand the queries and change them deliberately. You do not need a separate metrics service or another database.
Keep Grafana on a trusted private connection. Use its provisioned puls-tsdb PostgreSQL datasource, which connects as the grafana database role. Avoid connecting a dashboard as the database superuser. Grafana's own PostgreSQL setup guidance recommends restricting the datasource account to SELECT permissions.
Read-only does not mean private between viewers. The reference stack's Grafana role can read health records belonging to multiple users. A dashboard variable is a query filter, not an authorization boundary. Share access only with people entitled to use that datasource; use the account-aware PulsHealth viewer for a different access model.
Import the starter dashboard
Download dashboard.json, along with its README. The matching SQL templates are available separately for inspection.
In Grafana, open the dashboard import screen, upload the JSON, and save it with a name you recognize. The template references the existing puls-tsdb datasource UID. If you use a separately installed Grafana, configure an appropriate read-only PostgreSQL connection and change the dashboard's datasource references to match it.
Set User UUID to your existing PulsHealth user ID. The default is an all-zero placeholder and should return no records. Get the correct UUID from your own app or stack configuration; the template intentionally does not list everyone's names or email addresses.
Set the dashboard's display time zone to the stack's PULS_TIME_ZONE, and choose a range with known records. This is especially important for midnight daily points: a local-day timestamp displayed in another zone can appear on the preceding date.
The expected first result is straightforward:
| Panel | What you should see |
|---|---|
| Daily steps by provenance | Daily values, distinguished as aggregate or rollup |
| Hours since latest received batch | A number when an upload arrived in the past 90 days |
| Recorded workout duration | One point per workout, in minutes |
| Daily step provenance | A table containing day, value, and calculation source |
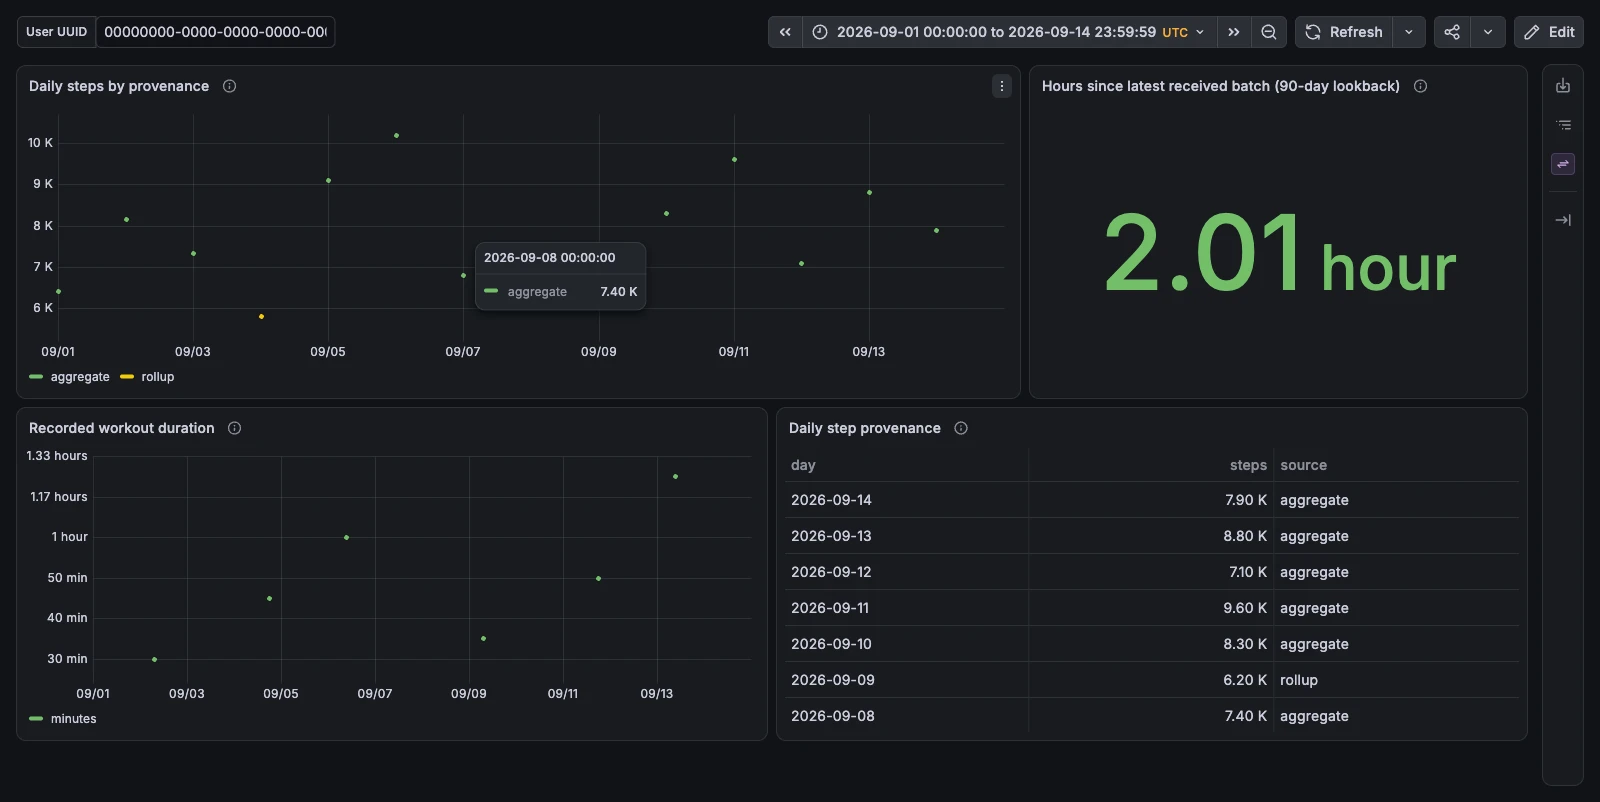
No data is a useful diagnostic result. Check the user, selected dates, sync coverage, and aggregate configuration before changing the query to accept unrelated rows.
Use daily summaries for daily steps
The tempting query sums every step sample by date. The problem is that an iPhone and Apple Watch can contribute overlapping records. A sum of all raw samples can become a sum of competing descriptions of the same activity.
PulsHealth's metric_daily view is designed for daily analysis. It prefers the canonical all-device daily HealthKit aggregate when available. Its cumulative-metric fallback uses the highest single-source daily sum rather than adding all sources together. These are different calculations, which is why the dashboard preserves the source column. The full rules are in the database guide.
The essential query is:
SELECT day::timestamp AT TIME ZONE puls_time_zone() AS time,
       value, source AS metric
FROM metric_daily
WHERE identifier = 'HKQuantityTypeIdentifierStepCount'
  AND user_id = ${user:sqlstring}::uuid
  AND day >= ($__timeFrom()::timestamptz
              AT TIME ZONE puls_time_zone())::date
  AND day <= ($__timeTo()::timestamptz
              AT TIME ZONE puls_time_zone())::date
ORDER BY time
This is a Grafana SQL template, not SQL to paste unchanged into psql. Grafana substitutes the variable and time macros. Its query-editor documentation explains the macro expansion and Query Inspector.
The filter includes whole local calendar days intersecting the selected range. Selecting noon to noon does not divide a daily total into half-days. The current day can also be incomplete. Choose completed days when comparing totals, and check the provenance table when an aggregate becomes a fallback.
Only metrics with the appropriate configured sum or average series appear in this view. If steps are missing, verify that the phone's aggregate configuration includes the canonical daily all-device sum and that you applied it. A raw-sample sync alone does not guarantee the daily view is configured as intended.
Plot recorded workouts as individual events
Workout durations need a different representation. Each row is a session, so the template uses points rather than drawing a continuous signal between runs and walks:
SELECT start_ts AS time, duration_s / 60.0 AS minutes
FROM workouts
WHERE user_id = ${user:sqlstring}::uuid
  AND $__timeFilter(start_ts)
ORDER BY time
The time filter acts on the workout's start instant. A session that begins before the range and ends inside it is therefore excluded. The duration field is used directly; subtracting start from end can answer a different question when a session contains pauses.
This panel measures recorded workouts, not all exercise. Two recording apps can create different records for the same session, and an unrecorded walk will not appear. Start by comparing a known workout's date and duration with its source before using record counts to assess consistency.
For weekly charts, date boundaries and absent records require another explicit decision. The Python walkthrough shows a reproducible way to make that decision and report coverage.
Separate upload freshness from measurement freshness
A dashboard that quietly stops receiving data can still look convincing. The receipt-age panel makes one operational fact visible: how many hours have elapsed since the server received the latest batch for the chosen user.
It uses a rolling 90-day lookback and deliberately ignores the dashboard time picker. If you inspect last month's workouts, you still want to know whether uploads are arriving now. If there is no batch in that lookback, the panel displays “No data.”
A recent receipt does not prove that every HealthKit type is current. A phone can upload historical records during a backfill; a batch may contain one type while another remains unavailable. Compare the newest actual measurement for the metric you care about when investigating freshness. The upload stat is a starting point, not a “sync complete” badge.
Check one known day before expanding
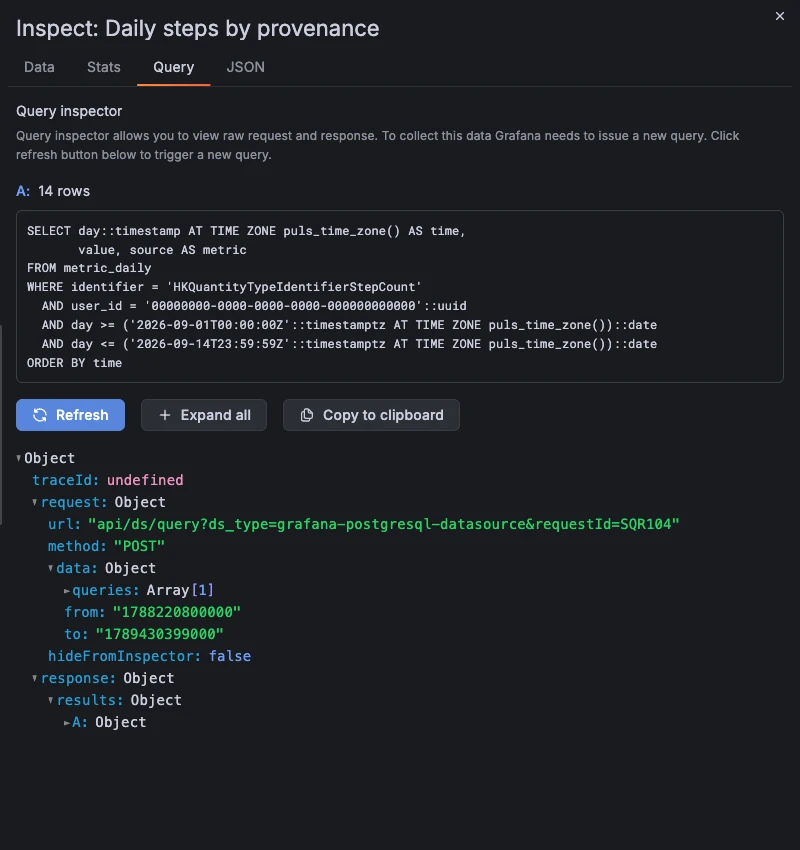
Open Query Inspector on each panel. Confirm that the expanded SQL contains your intended user and time bounds. The template uses ${user:sqlstring} for quoting and a UUID cast for type checking; see Grafana's variable documentation for how substitution works.
Choose one completed day and compare its step value, provenance, and workout records with the underlying data. Then test a range with no records. An empty chart should remain empty; avoid filling every missing day with zero to make a continuous-looking series.
The download's four queries were executed read-only against synthetic PostgreSQL tables with documented column shapes and explicit macro substitutions. Those checks excluded fixtures belonging to another user and records outside the requested dates. The same four queries also ran successfully in a read-only transaction against one owner’s production database: a seven-day window returned seven daily step rows, ten workout rows, seven provenance rows, and one receipt-age result. Only these counts are published. The exact dashboard was also rendered in Grafana 13.2.3 with synthetic PostgreSQL 17 fixtures: 14 daily values, six workouts, and a receipt-age result. Query Inspector confirmed the expanded date and UUID filters and 14 returned step rows. This checks the example's rendering and macro expansion, not production TimescaleDB performance. Compare a known day and check responsiveness in your own installation.
Once the small dashboard agrees with known records, add panels one question at a time. Keep units in the axis label, provenance available beside summaries, and time bounds on every large data query. A dashboard becomes valuable when you can explain what each number represents—and when it tells you clearly that it has no number to show.