An Apple Watch HRV reading is a measurement of variation between heartbeats. It is not a recovery score, a diagnosis, or a target you need to beat tomorrow. Before interpreting it, establish which HRV metric you are looking at, when it was recorded, and how much data sits behind the chart.
This guide focuses on SDNN, the Apple Health data type called HKQuantityTypeIdentifierHeartRateVariabilitySDNN. That distinction matters: Apple's current documentation also describes Recovery HRV on newer watches. Don't assume every number labeled HRV uses the same calculation or collection method. Apple's SDNN definition, current Apple Watch heart measurements.
Rewritten October 8, 2026: this revision replaces the earlier article's numerical “normal” ranges and illness-prediction claims with measurement guidance, primary sources, and an analysis of my own records.
What SDNN actually measures
Heart rate tells you how many beats occur per minute. HRV describes the spacing between beats. Two recordings can have the same average heart rate but different interval patterns: one relatively even, the other more variable.
SDNN is the standard deviation of normal-to-normal heartbeat intervals, expressed in milliseconds. A value of 45 ms is a measure of their spread within a recording; it does not mean your heart rate changed by 45 beats per minute. Apple stores SDNN as individual quantity samples in HealthKit. HealthKit documentation.
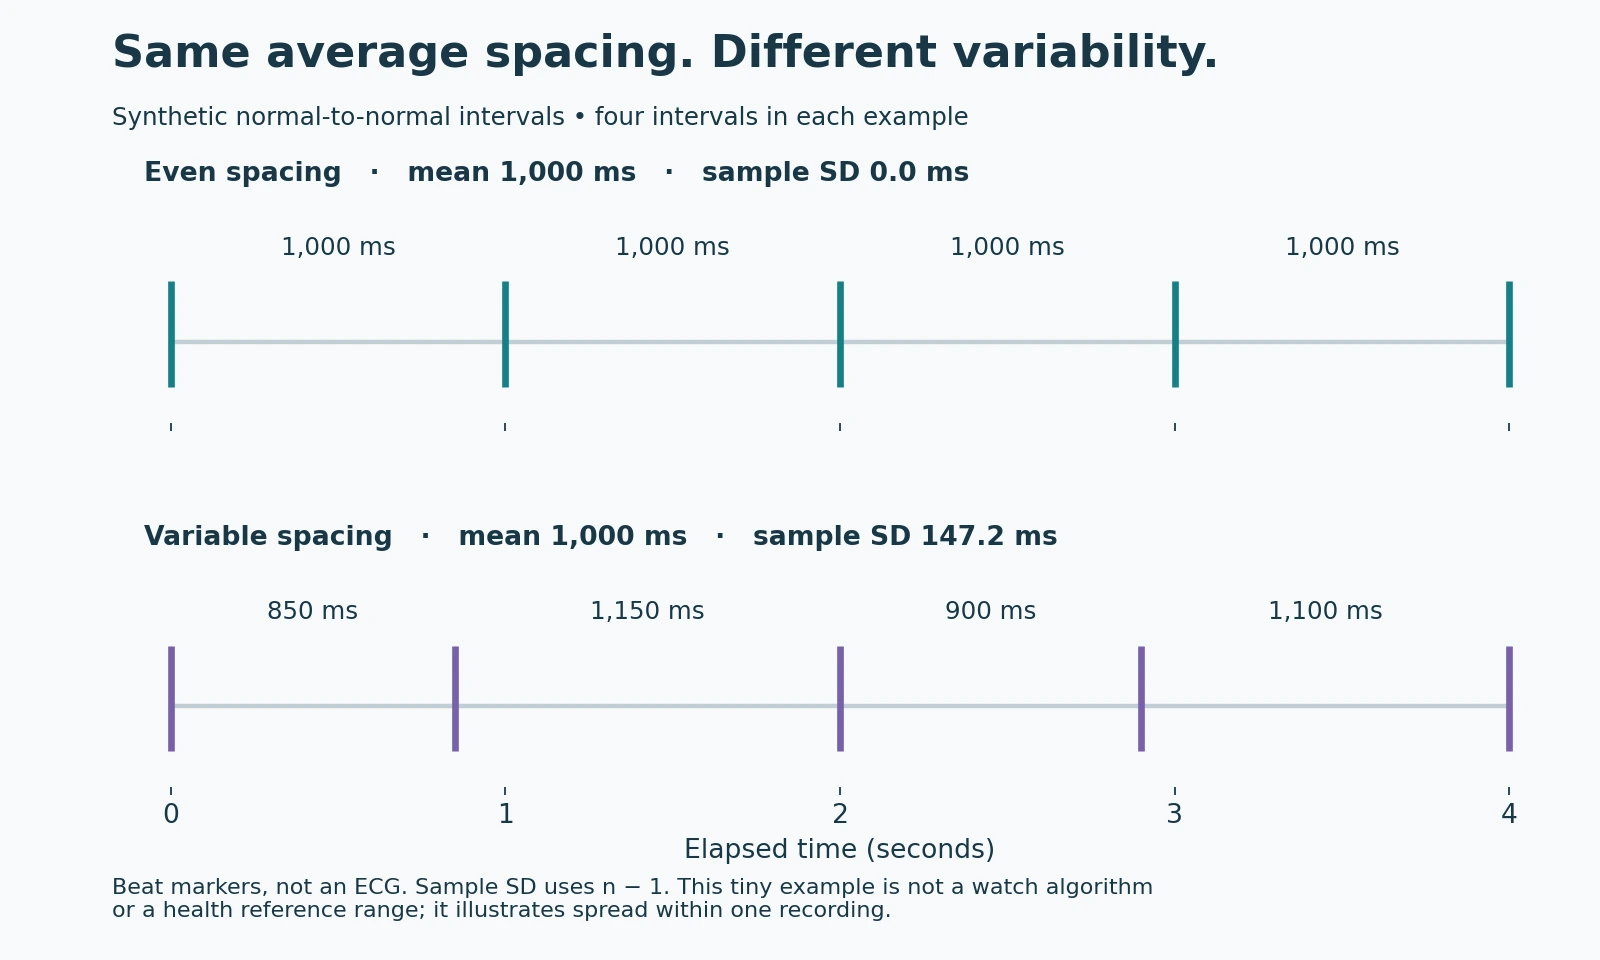
Other HRV calculations answer different mathematical questions. RMSSD, for example, uses successive differences between intervals. Having the same unit does not make two metrics interchangeable. The measurement standards distinguish these calculations and emphasize the recording conditions. ESC/EHRA position statement.
There is another easily missed distinction: the variation between your daily HRV values is not itself SDNN. Each stored SDNN value has already summarized a recording. Calculating the standard deviation of a month of those values measures how the summaries vary, not the beat-to-beat variability of that month.
Why there is no useful universal “good HRV” cutoff here
Recording duration changes what variability can be captured. A short observation and a day-long ECG incorporate different spans of physiology. The longstanding HRV measurement standard explicitly cautions against comparing SDNN from recordings of different durations. A clinical threshold from a 24-hour recording is therefore not a grading scale for a brief watch observation. HRV measurement standard.
Even short recordings need context. Posture, breathing conditions, and duration affect comparisons. This is why a deliberately paced breathing session and an incidental observation during the day should not automatically be treated as equivalent samples. ESC/EHRA position statement.
A personal history gives you a more relevant comparison set, but it does not solve every problem. If your measurement routine changes, your apparent baseline can change with it. “Lower than last month” is an observation to investigate; it is not enough information to identify the cause.
Is Apple Watch HRV accurate?
Accuracy depends on the metric, comparison device, and testing conditions. It is more useful to ask what a study actually tested than whether a watch is simply “accurate.”
A 2018 study compared Apple Watch interval recordings with a Polar H7 in 20 healthy participants during relaxation and mental stress. Its findings supported the feasibility of some HRV measurements under that protocol, while documenting gaps in the recorded intervals. It did not establish that every unattended daily reading predicts illness or recovery. Hernando and colleagues, 2018.
A later study compared Apple Watch Series 6 with laboratory ECG in 78 healthy adults across several controlled conditions. Agreement was strongest at rest; the authors also cautioned that laboratory results might not generalize to everyday life. Strong agreement for heart rate or beat intervals should not be casually restated as equally strong agreement for every derived HRV metric. Bonneval and colleagues, 2025.
These studies are reasons to take measurement conditions seriously. Neither validates a rule such as “below this number, skip your workout” for an individual reader.
What a month of my records looks like
For this revision, I examined my synced SDNN records from September 1 through September 30, 2026, using local calendar days in America/Los_Angeles. This is one person's observational example, not a reference population.
There were 402 observations across all 30 days. The daily count ranged from 11 to 15, with a median of 14 observations per day. Daily sample medians ranged from 40.78 to 78.17 ms.
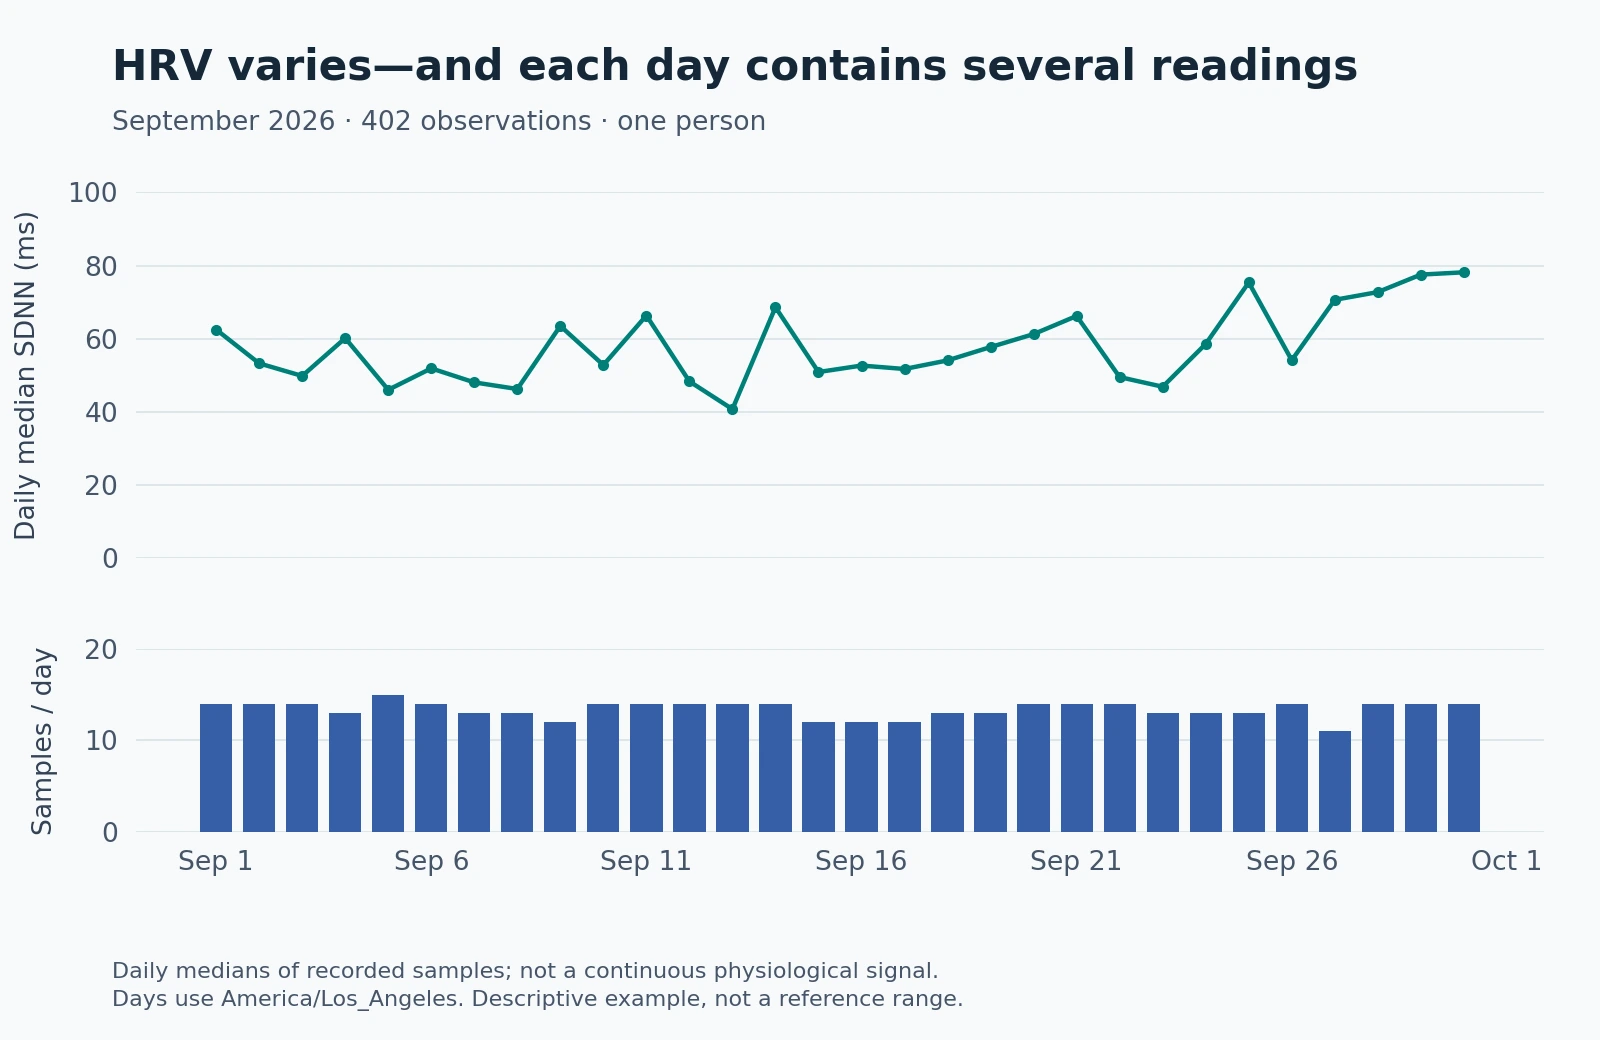
The counts are as useful as the line above them. They show that a daily summary comes from a small collection of observations, not continuous measurement of every heartbeat throughout the day. Observations occurred in every hour-of-day bin somewhere across the month; that does not mean every hour was represented on every day.
A daily median gives each day's recorded values a simple summary. It does not reconstruct the unobserved hours. Nor does the chart establish why a day was higher or lower. There is no controlled comparison here, and the figure does not label changes as stress, sickness, or fitness improvement.
Method: select this account's SDNN quantity samples with start times at or after September 1 and before October 1 in the stated zone; group by local start date; count observations and calculate the median of stored millisecond values. These are medians of individual SDNN samples, not an Apple Health daily average or an SDNN calculated from a continuous day of beat intervals.
How to examine your own trend
Start in Apple Health by searching for Heart Rate Variability and inspecting individual records and their sources. Then make a small analysis that keeps the evidence visible:
- Keep the metric consistent. Select SDNN explicitly; don't mix similarly named measures or convert another device's score into SDNN.
- Count observations beside the values. A day with one reading deserves a different interpretation from a day with many. Leave missing days blank rather than assigning zero.
- Check time and source. Separate sources when appropriate, and look for a changed recording routine before attributing a shift to health.
- Use a declared summary. Label a mean, median, or rolling average accurately. A smoother line hides variation; it does not add measurements.
- Write down the question before the explanation. “Did recorded SDNN change this month?” can be answered descriptively. “Did my new routine cause it?” requires stronger evidence.
You can inspect sampling and value distributions in PulsHealth's Explore tab, or export selected records to examine them yourself. The export documentation explains the file formats and what they retain.
What to do with a surprising number
First check whether it is one sample, a daily summary, or a differently named metric. Look at its source and the observations around it. A sharp-looking change can warrant closer inspection without carrying an identifiable medical meaning.
Do not use a reassuring HRV number to dismiss symptoms, or an isolated low value to diagnose yourself. If a persistent change concerns you, bring the dated records and relevant context to a clinician rather than a screenshot with a red threshold drawn across it. The useful result of tracking is a clearer question, supported by traceable measurements.